We are committed to continuing our deep dive into Git from the Bottom Up by John Wiegley, while Allen puts too much thought into onions, Michael still doesn’t understand proper nouns, and Joe is out hat shopping.
Ludum Dare is a bi-annual game jam that’s been running for over 20 years now. Jam #51 is coming up Sept 30th to October 3rd. (ldjam.com)
We previously talked about Ludum Dare in episode 146.
Commitment Issues
Commits
A commit can have one or more parents.
Those commits can have one more parents.
It’s for this reason that commits can be treated like branches, because they know their entire lineage.
You can examine top level referenced commits with the following command: git branch -v.
A branch is just a named reference to a commit!
A branch and a tag both name a commit, with the exception that a tag can have a description, similar to a commit.
Branches are just names that point to a commit.
Tags have descriptions and point to a commit.
Knowing the above two points, you actually don’t technically need branches or tags. You could do everything pointing to the commit hash id’s if you were insane enough to do so.
Here’s a dangerous command:
git reset --hard commitHash – This is dangerous. --hard says to erase all changes in the working tree, whether they were registered for a check-in or not and reset HEAD to point to the commitHash.
Here’s a safer command:
git checkout commitHash – This is a safer option, because files changed in the working tree are preserved. However, adding the -f parameter acts similar as the previous command, except that it doesn’t change the branch’s HEAD, and instead only changes the working tree.
Some simple concepts to grasp:
If a commit has multiple parents, it’s a merge commit.
If a commit has multiple children, it represents the ancestor of a branch.
Simply put, Git is a collection of commits, each of which holds a tree which reference other trees and blobs, which store data.
All other things in Git are named concepts but they all boil down to the above statement.
A commit by any other name
The key to knowing Git is to truly understand commits.
Learning to name your commits is the way to mastering Git.
branchname – The name of a branch is an alias to the most recent commit on that branch.
tagname – Similar to the branch name in that the name points to a specific commit but the difference is a tag can never change the commit id it points to.
HEAD – The currently checked out commit. Checking out a specific commit takes you out of a “branch” and you are then in a “detached HEAD” state.
The 40 character hash id – A commit can always be referenced by the full SHA1 hash.
You can refer to a commit by a shorter version of the hash id, enough characters to make it unique, usually 6 or 7 characters is enough.
name^ – Using the caret tells Git to go to the parent of the provided commit. If a commit has more than one parent, the first one is chosen.
name^^ – Carets can be stacked, so doing two carets will give the parent of the parent of the provided commit.
name^2 – If a commit has multiple parents, you can choose which one to retrieve by using the caret followed by the number of the parent to retrieve. This is useful for things like merge commits.
name~10 – Same thing as using the commit plus 10 carets. It refers to the named commit’s 10th generation ancestor.
name:path – Used to reference a specific file in the commit’s content tree, excellent when you need to do things like compare file diffs in a merge, like: git diff HEAD^1:somefile HEAD^2:somefile.
name^{tree} – Reference the tree held by a commit rather than the commit itself.
name1..name2 – Get a range of commits reachable from name2 all the way back to, but not including, name1. Omitting name1 or name2 will substitute HEAD in the place.
name1…name2 – For commands like log, gets the unique commits that are referenced by name1 or name2. For commands like diff, the range is is between name2 and the common ancestor of name1 and name2.
main.. – Equivalent to main..HEAD and useful when comparing changes made in the current branch to the branch named main.
..main – Equivalent to HEAD..main and useful for comparing changes since the last rebase or merge with the branch main, after fetching it.
-since=”2 weeks ago” – All commits from a certain relative date.
–until=”1 week ago” – All commits before a certain relative date.
–grep=pattern – All commits where the message meets a certain regex pattern.
–committer=pattern — Find all the commits where the committer matches a regex pattern.
–author=pattern – All commits whose author matches the pattern.
So how’s that different than the committer? “The author of a commit is the one who created the changes it represents. For local development this is always the same as the committer, but when patches are being sent by e-mail, the author and the committer usually differ.”
–no-merges – Only return commits with a single parent, i.e. ignore all merge commits.
Not sure where the history of your branch started from and want an easy button? Check out Allen’s TotW from episode 182.
Need to search the entire history of the repo for some content (text, code, etc.) that’s not part of the current branch? Content, not a commit comment, not a commit ID, but content. Check out Michael’s TotW from episode 31.
Nobody Likes Onions, a podcast that has been making audiences laugh at the absurd, the obvious, and the wrong, for a very long time. (NobodyLikesOnions.com)
Tip of the Week
Supabase is an open-source alternative to Google’s Firebase that is based on PostgreSQL. The docs are great and it’s really easy to work through the “Getting Started” guide to set up a new project in the top framework of your choice, complete with a (for now) free, hosted PostgreSQL database on Heroku, with authentication (email/password or a myriad of providers). RBAC is controlled via database policies and everything can be administered through the portal. You can query the database with a simple DSL. Joe was able to work through a small project and get it hosted on Netlify (with SSL!) all for free in under 2 hours. (supabase.com)
Obsidian is a really cool way to associate markdown data with your files. (Thanks Simon Barker!) (obsidian.md)
Ever use a “mind map” tool? MindNode is a great, free, mind mapping tool to help you organize your thoughts (Thanks Sean Martz!) (mindnode.com)
Ink Drop is a cool way to organize and search your markdown files (inkdrop.app) (Thanks Lars!)
Tired of git log knocking the rest of your content off screen? You can configure Git to run a custom “core.pager” command with the args you prefer: (serebrov.github.io)
To configure just Git: git config --global --replace-all core.pager "less -iXFR"
Or, to modify how less prints to the screen and commands that rely on it, including Git, edit your ~/.bashrc or ~/.zshrc, etc. and add export LESS=-iXFR to the file.
It’s surprising how little we know about Git as we continue to dive into Git from the Bottom Up, while Michael confuses himself, Joe has low standards, and Allen tells a joke.
Thanks for all the great feedback on the last episode and for sticking with us!
Directory Content Tracking
Put simply, Git just keeps a snapshot of a directory’s contents.
Git represents your file contents in blobs (binary large object), in a structure similar to a Unix directory, called a tree.
A blob is named by a SHA1 hashing of the size and contents of the file.
This verifies that the blob contents will never change (given the same ID).
The same contents will ALWAYS be represented by the same blob no matter where it appears, be it across commits, repositories, or even the Internet.
If multiple trees reference the same blob, it’s simply a hard link to the blob.
As long as there’s one link to a blob, it will continue to exist in the repository.
A blob stores no metadata about its content.
This is kept in the tree that contains the blob.
Interesting tidbit about this: you could have any number of files that are all named differently but have the same content and size and they’d all point to the same blob.
For example, even if one file were named abc.txt and another was named passwords.bin in separate directories, they’d point to the same blob.
The author creates a file and then calculates the ID of the file using git hash-object filename.
If you were to do the same thing on your system, assuming you used the same content as the author, you’d get the same hash ID, even if you name the file different than what they did.
git cat-file -t hashID will show you the Git type of the object, which should be blob.
git cat-file blob hashID will show you the contents of the file.
The commands above are looking at the data at the blob level, not even taking into account which commit contained it, or which tree it was in.
Git is all about blob management, as the blob is the fundamental data unit in Git.
Blobs are Stored in Trees
Remember there’s no metadata in the blobs, and instead the blobs are just about the file’s contents.
Git maintains the structure of the files within the repository in a tree by attaching blobs as leaf nodes within a tree.
git ls-tree HEAD will show the tree of the latest commit in the current directory.
git rev-parse HEAD decodes the HEAD into the commit ID it references.
git cat-file -t HEAD verifies the type for the alias HEAD (should be commit).
git cat-file commit HEAD will show metadata about the commit including the hash ID of the tree, as well as author info, commit message, etc.
To see that Git is maintaining its own set of information about the trees, commits and blobs, etc., use find .git/objects -type f and you’ll see the same IDs that were shown in the output from the previous Git commands.
How Trees are Made
There’s a notion of an index, which is what you use to initially create blobs out of files.
If you just do a git add without a commit, assuming you are following along here (jwiegly.github.io), git log will fail because nothing has been committed to the repository.
git ls-files --stage will show your blob being referenced by the index.
At this point the file is not referenced by a tree or a commit, it’s only in the .git/index file.
git write-tree will take the contents of the index and write it to a tree, and the tree will have it’s own hash ID.
If you followed along with the link above, you’d have the same hash from the write-tree that we get.
A tree containing the same blob and sub-trees will always have the same hash.
The low-level write-tree command is used to take the contents of the index and write them into a new tree in preparation for a commit.
git commit-tree takes a tree’s hash ID and makes a commit that holds it.
If you wanted that commit to reference a parent, you’d have to manually pass in the parent’s commit ID with the -p argument.
This commit ID will be different for everyone because it uses the name of the creator of the commit as well as the date when the commit is created to generate the hash ID.
Now you have to overwrite the contents of .git/refs/heads/master with the latest commit hash ID.
This tells Git that the branch named master should now reference the new commit.
A safer way to do this, if you were doing this low-level stuff, is to use git update-ref refs/heads/master hashID.
git symbolic-ref HEAD refs/heads/master then associates the working tree with the HEAD of master.
What Have We Learned?
Blobs are unique!
Blobs are held by Trees, Trees are held by Commits.
HEAD is a pointer to a particular commit.
Commits usually have a parent, i.e. previous, commit.
We’ve got a better understanding of the detached HEAD state.
What a lot of those files mean in the .git directory.
Resources We Like
Things I wish everyone knew about Git (Part 1) (blog.plover.com)
Have you ever heard the tale of … the forbidden files in Windows? Windows has a list of names that you cannot use for files. Twitter user @foone has done the unthinkable and created a repository of these files. What would happen if you checked this repository out on Windows?
Check out this convenient repository in Windows. (GitHub)
When you use mvn dependency:tree, grep is your enemy. If you want to find out who is bringing in a specific dependency, you really need to use the -Dincludes flag.
Thanks to @ttutko for this tip about redirecting output:
kafkacat 2>&1 | grep "". If you’re not familiar with that syntax, it just means pipe STDERR to STDOUT and then pipe that to grep.
Thanks Volkmar Rigo for this one!
Dangit, Git!? Git is hard: messing up is easy, and figuring out how to fix your mistakes is impossible. This website has some tips to get you out of a jam. (DangitGit.com)
How to vacay … step 1 temporarily disable your work email (and silence Slack, Gchat, whateves).
On iOS, go to Settings -> Mail -> Accounts -> Select your work account -> Turn off the Mail slider.
After working with Git for over a decade, we decide to take a deep dive into how it works, while Michael, Allen, and Joe apparently still don’t understand Git.
This is the book Outlaw was trying to remember … we think!
How to approach Git; general strategy
This episode was inspired by an article written by Mark Dominus.
Git commits are immutable snapshots of the repository.
Branches are named sequences of commits.
Every object gets a unique id based on its content.
The author is not a fan of how the command set has evolved over time.
With Git, you need to think about what state your repository is in, and what state you would like to be in.
There are likely a number of ways to achieve that desired state.
If you try to understand the commands without understanding the model, you can get lost. For example:
git reset does three different things depending on the flags used,
git checkout even worse (per the author), and
The opposite of git-push is not git-pull, it’s git-fetch.
Possibly the worst part of the above is if you don’t understand the model and what’s happening to the model, you won’t know the right questions to ask to get back into a good state.
Mark said the thing that saved him from frustration with Git is the book Git from the Bottom Up by John Wiegley (jwiegley.github.io)
Mark doesn’t love Git, but he uses it by choice and he uses it effectively. He said that reading Wiegley’s book is what changed everything for him. He could now “see” what was happening with the model even when things went wrong.
It is very hard to permanently lose work. If something seems to have gone wrong, don’t panic. Remain calm and ask an expert.
Mark Dominus
Git from the Bottom Up
A repository – “is a collection of commits, each of which is an archive of what the project’s working tree looked like at a past date, whether on your machine or someone else’s.” It defines HEAD, which identifies the branch or commit the current tree started from, and contains a set of branches or tags that allow you to identify commits by a name.
The index is what will be committed on the next commit. Git does not commit changes from the working tree into the repository directly so instead, the changes are registered into the index, which is also referred to as a staging area, before committing the actual changes.
A working tree is any directory on your system that is associated with a Git repository and typically has a .git folder inside it.
Why typically? Thanks to the git-worktree command, one .git directory can be used to support multiple working trees, as previously discussed in episode 128.
A commit is a snapshot of your working tree at some point in time. “The state of HEAD (see below) at the time your commit is made becomes that commit’s parent. This is what creates the notion of a ‘revision history’.”
A branch is a name for a commit, also called a reference. This stores the history of commits, the lineage and is typically referred to as the “branch of development”
A tag is also a name for a commit, except that it always points to the same commit unlike a branch which doesn’t have to follow this rule as new commits can be made to the branch. A tag can also have its own description text.
master was typically, maybe not so much now, the default branch name where development is done in a repository. Any branch name can be configured as the default branch. Currently, popular default branch names include main, trunk, and dev.
HEAD is an alias that lets the repository identify what’s currently checked out. If you checkout a branch, HEAD now symbolically points to that branch. If you checkout a tag, HEAD now refers only to that commit and this state is referred to as a “detached HEAD“.
The typical work flow goes something like:
Create a repository,
Do some work in your working tree,
Once you’ve achieved a good “stopping point”, you add your changes to the index via git add, and then
Once your changes are in the state you want them and in your index, you are ready to put your changes into the actual repository, so you commit them using git commit.
Resources We Like
Things I wish everyone knew about Git (Part 1) (blog.plover.com)
Designing Data-Intensive Applications – SSTables and LSM-Trees (episode 128)
Celeste is quite a game, it’s challenging but rewarding…or accessible and rewarding. Just go play it already!
Tip of the Week
Celeste is a tough, but forgiving game that is on all major platforms. It was developed by a tiny team, 2 programmers, and it’s a really rewarding and interesting experience. Don’t sleep on this game any longer! (CelesteGame.com)
Enforcer Maven plugin is a tool for unknotting dependency version problems, which can easily get out of control and be a real problem when trying to upgrade!
Maven Enforcer Plugin – The Loving Iron Fist of MavenTM (maven.apache.org)
Tired of sending messages too early in Slack? You can set your Slack preferences to make ENTER just do a new line! Then use CMD + ENTER on MacOS or CTRL + ENTER on Windows to send the message! Thanks for the amazing tip from Jim Humelsine! (Slack)
Using Docker Desktop, and want to run a specific version? Well … you can’t really! You have to pick a version of Docker Desktop that corresponds to your target version of Kubernetes!
Alternatively you can just use Minikube to target a specific Kubernetes version (minikube.sigs.k8s.io)
Save a life, donate blood, platelets, plasma, or marrow (redcrossblood.org)
What if you want to donate blood marrow or cord blood? You need to be matched with a recipient first. Check eligibility on the website at Be The Match. (bethematch.org)
Also, not quite as important, you can disable all of the stupid sounds (bells) in WSL!
Disable beep in WSL terminal on Windows 10 (Stack Overflow)
Once again, Stack Overflow takes the pulse of the developer community where we have all collectively decided to switch to Clojure, while Michael is changing things up, Joe is a future predicting trailblazer, and Allen is “up in the books”.
Joe’s going to be speaking at the Orlando Elastic Meetup about running Elasticsearch in Kubernetes on July 27th 2022 (Meetup)
Recommendation, keep your API interface in separate modules from your implementation! That makes it easier to re-use that code in new ways without having to refactor first.
Do you worry about talking too much in virtual meetings? This app monitors your mic and lets you know when you’re waffling on. (unblah.me)
Did you know you can do a regex search in grep? Example: grep -Pzo "(?s)^(\s)\Nmain.?{.?^\1}" *.c (Stack Overflow)
But what if you want to do that in vim? By default vim treats characters literally, but you can turn on “magic” characters with :set magic and then you’re off to the races! (Stack Overflow)
Looking for some great IntelliJ Code Completion Tips? Check out this video! (YouTube)
Did you know yum install will not return an error code when installing multiple packages at the same time if one succeeds and another fails. Yikes! So be sure to install your dependencies independent of their dependents. (Stack Overflow)
We’re going back in time, or is it forward?, as we continue learning about Google’s automation evolution, while Allen doesn’t like certain beers, Joe is a Zacker™, and Michael poorly assumes that UPSes work best when plugged in.
A cautionary, err, educational tale of automating MySQL for Ads and automating replica replacements.
Migrating MySQL to Borg (Google Cluster Manager)
Large-scale cluster management at Google with Borg (research.google)
Desired goals of the project:
Eliminate machine/replica maintenance,
Ability to run multiple instances on same machine.
Came with additional complications – Borg task moving caused problems for master database servers.
Manual failovers took a long time.
Human involvement in the failovers would take longer than the required 30 seconds or less downtime.
Led to automating failover and the birth of MoB (MySQL on Borg).
Again, more problems because now application code needed to become much more failure tolerant.
After all this, mundane tasks dropped by 95%, and with that they were able to optimize and automate other things causing total operational costs to drop by 95% as well.
Automating Cluster Delivery
Story about a particular setup of Bigtable that didn’t use the first disk of a 12 disk cluster.
Some automation thought that if the first disk wasn’t being utilized, then none of the disks weren’t configured and were safe to be wiped.
Automation should be careful about implicit “safety” signals.
Cluster delivery automation depended on a lot of bespoke shell scripts which turned out to be problematic over time.
Detecting Inconsistencies with ProdTest
ProdTest contained chained “unit” tests that would figure out where problems began
Cluster automations required custom flags, which led to constant problems / misconfigurations.
Shell scripts became brittle over time.
Were all the services available and configured properly?
Were the packages and configurations consistent with other deployments?
Could configuration exceptions be verified?
For this, ProdTest was created.
Tests could be chained to other tests and failures in one would abort causing subsequent tests to not run.
The tests would show where something failed and with a detailed report of why.
If something new failed, they could be added as new tests to help quickly identify them in the future.
These tools gave visibility into what was causing problems with cluster deployments.
While the finding of things quicker was nice, that didn’t mean faster fixes. Dozens of teams with many shell scripts meant that fixing these things could be a problem.
The solution was to pair misconfigurations with automated fixes that were idempotent
This sounded good but in reality some fixes were flaky and not truly idempotent and would cause the state to be “off” and other tests would now start failing.
There was also too much latency between a failure, the fix, and another run.
Specializing
Automation processes can vary in one of three ways:
Competence,
Latency,
Relevance: the proportion of real world processes covered by automation.
They attempted to use “turnup” teams that would focus on automation tasks, i.e. teams of people in the same room. This would help get things done quicker.
This was short-lived.
Could have been over a thousand changes a day to running systems!
When the automation code wasn’t staying in sync with the code it was covering, that would cause even more problems. This is the real world. Underlying systems change quickly and if the automation handling those systems isn’t kept up, then more problems crop up.
This created some ugly side effects by relieving teams who ran services of the responsibility to maintain and run their automation code, which created ugly organizational incentives:
A team whose primary task is to speed up the current turnup has no incentive to reduce the technical debt of the service-owning team running the service in production later.
A team not running automation has no incentive to build systems that are easy to automate.
A product manager whose schedule is not affected by low-quality automation will always prioritize new features over simplicity and automation.
Turnups became inaccurate, high-latency, and incompetent.
They were saved by security by the removal of SSH approaches to more auditable / less-privileged approaches.
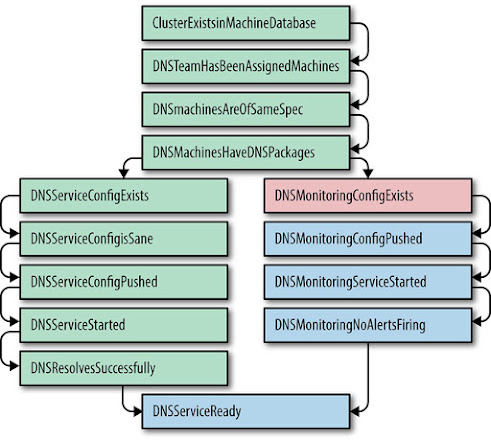
Service Oriented Cluster Turnup
Changed from writing shell scripts to RPC servers with fine-grained ACL (access control lists).
Service owners would then create / own the admin servers that would know how their services operated and when they were ready.
These RPC’s would send more RPC’s to admin server’s when their ready state was reached.
This resulted in low-latency, competent, and accurate processes.
Autonomous systems that need no human intervention”
Borg: Birth of the Warehouse-Scale Computer
In the early days, Google’s clusters were racks of machines with specific purposes.
Developers would log into machines to perform tasks, like delivering “golden” binaries.
As Google grew, so did the number and type of clusters. Eventually machines started getting a descriptor file so developers could act on types of machines.
Automation eventually evolved to storing the state of machines in a proper database, with sophisticated monitoring tools.
This automation was severely limited by being tied to physical machines with physical volumes, network connections, IP addresses, etc.
Borg let Google orchestrate at the resource level, allocating compute dynamically. Suddenly one physical computer could have multiple types of workloads running on it.
This let Google centralize it’s logic, making it easier to make systemic changes that improve efficiency, flexibility, and reliability.
This allowed Google to greatly scale it’s resources without scaling it’s labor.
Thousands of machines are born, die, and go into repair daily without any developer interaction.
They effectively turned a hardware problem into a software problem, which allowed them to take advantage of well known techniques and algorithms for scheduling processes.
This couldn’t have happened if the system wasn’t self-healing. Systems can’t grow past a certain point without this.
Reliability is the Fundamental Feature
Internal operations that automation relies on needs to be exposed to the people as well.
As systems become more and more automated, the ability for people to reason about the system deteriorates due to lack of involvement and practice.
They say that the above is true when systems are non-autonomous, i.e. the manual actions that were automated are assumed to be able to be done manually still, but doesn’t reflect the current reality.
While Google has to automate due to scale, there is still a benefit for software / systems that aren’t that at their scale and this is reliability. Reliability is the ultimate benefit to automation.
Automation also speeds processes up.
Best to start thinking about automation in the design phase as it’s difficult to retrofit.
Beware – Enabling Failure at Scale
Story about automation that wiped out almost all the machines on a CDN because when they re-ran the process to do a Diskerase, it found that there were no machines to wipe, but the automation then saw the “empty set” as meaning, wipe everything.
This caused the team to build in more sanity checks and some rate limiting!
Resources We Like
Links to Google’s free books on Site Reliability Engineering (sre.google)
Apple’s Self Service Repair now available (apple.com)
Tip of the Week
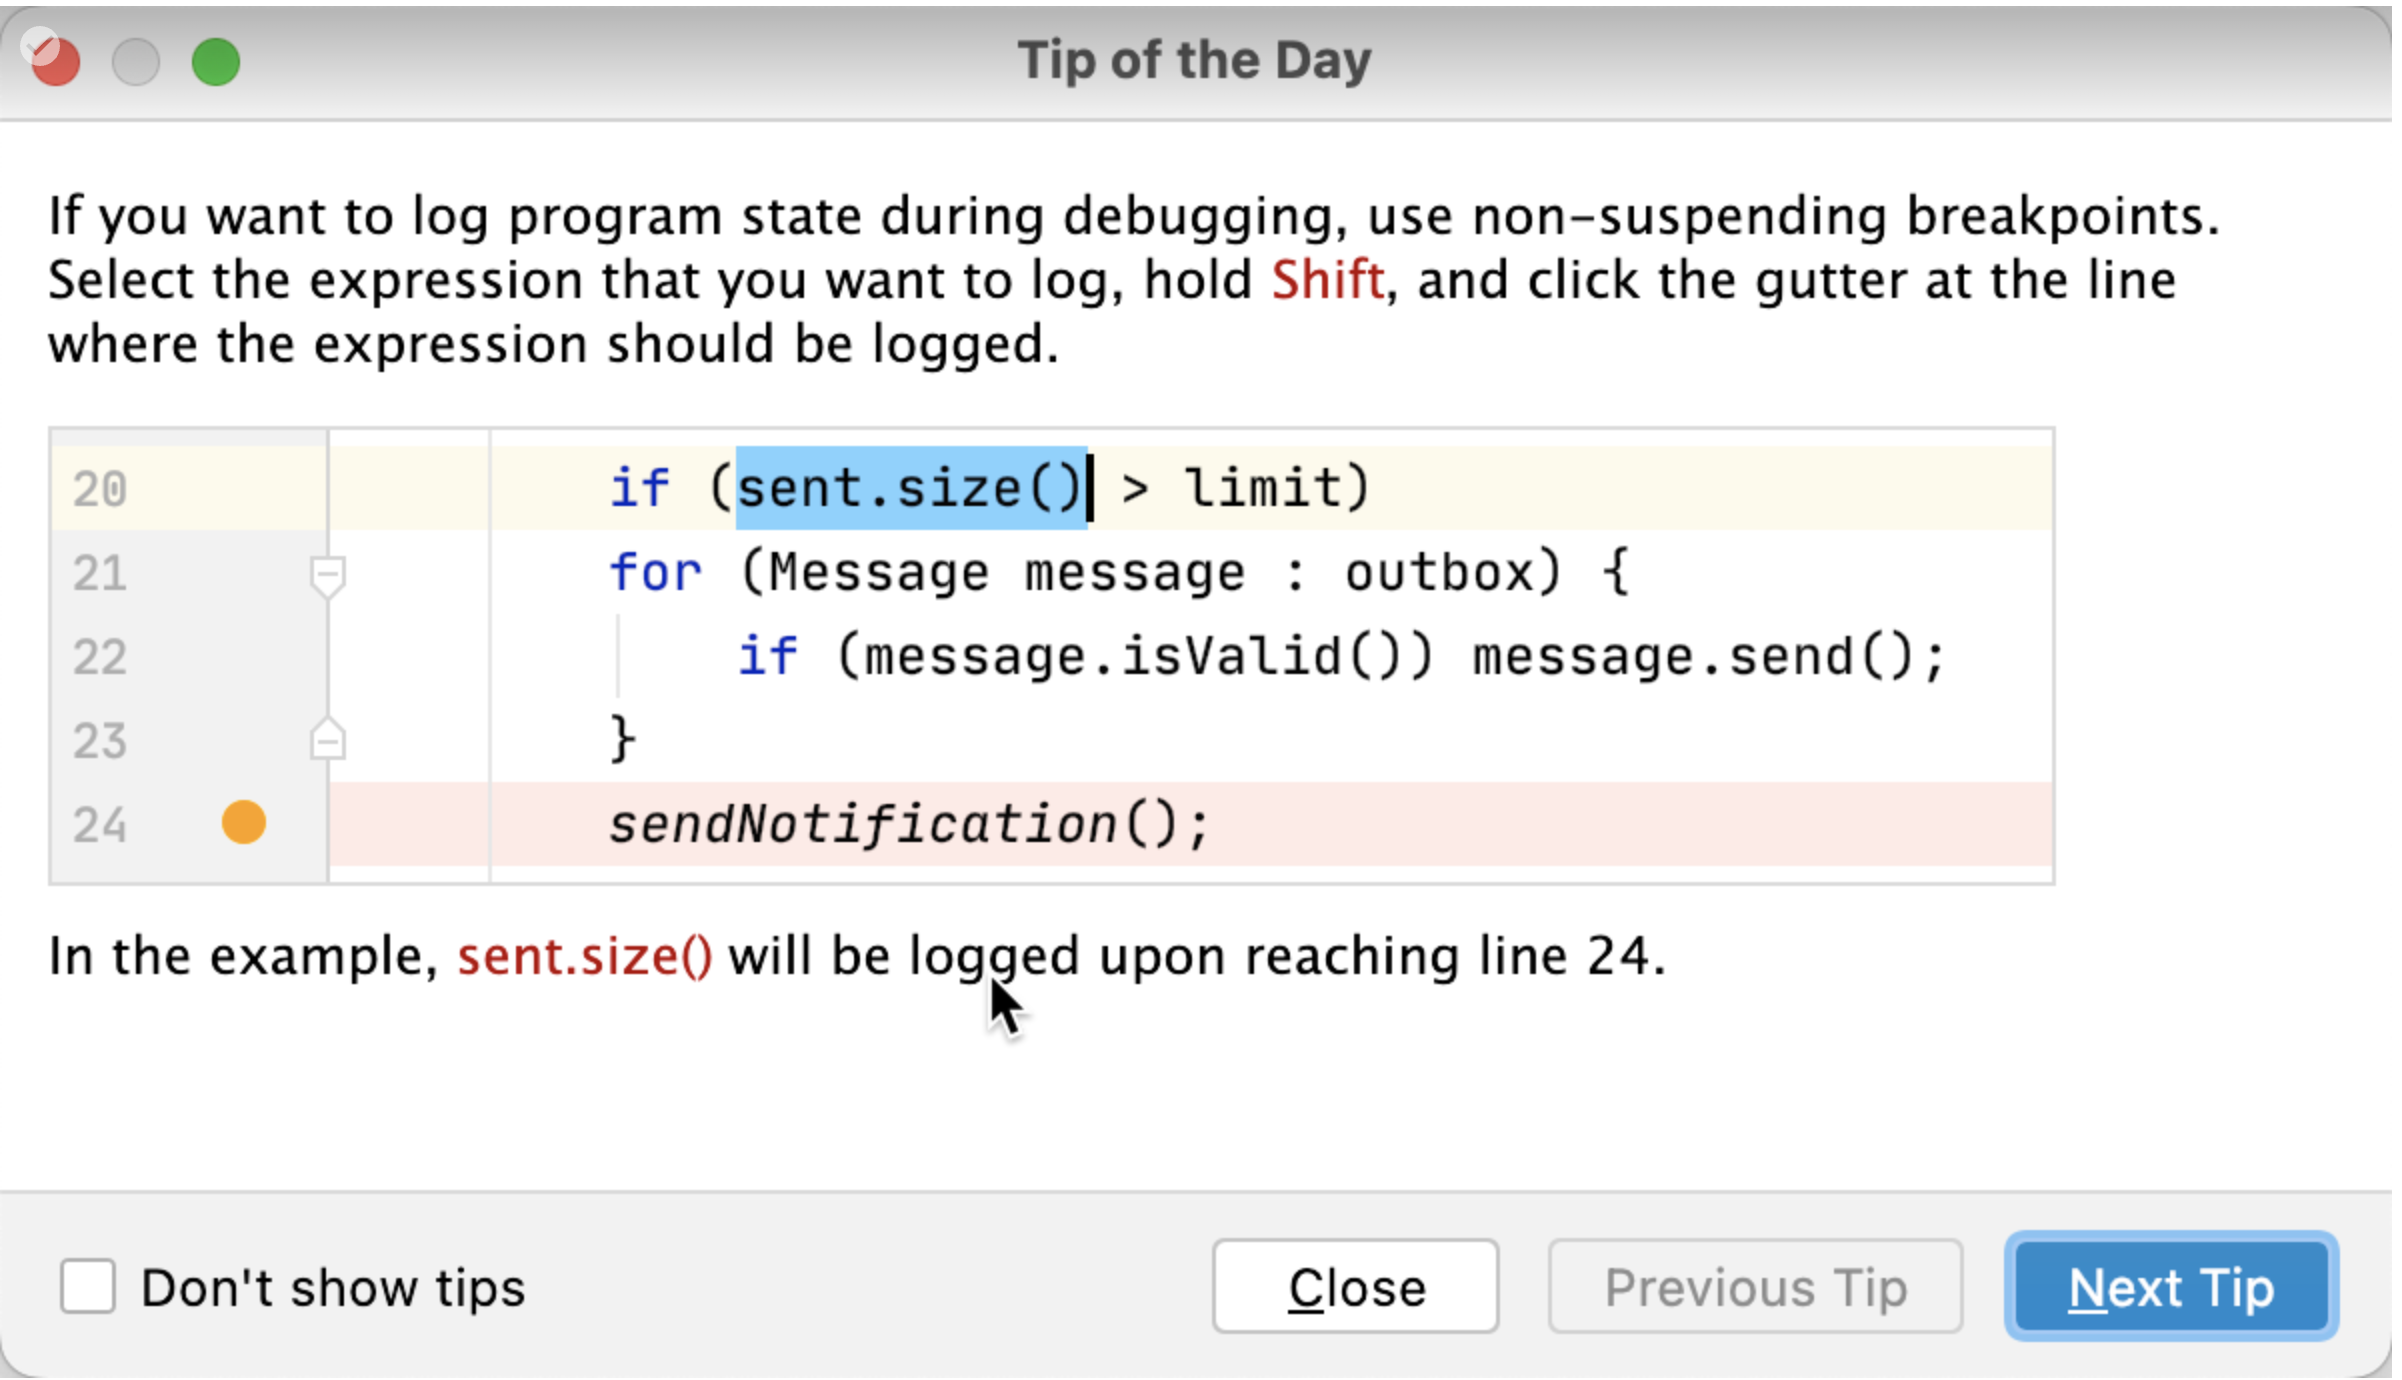
Jetbrains makes it easy to log values at debug time!
kubectl debug is a useful utility command that helps you debug issues. Here are a couple examples from the docs using kubectl debug (kubernetes.io)
Adding ephemeral debug containers to pods,
Copying existing pods and add additional containers,
Debugging pending pods,
Pods that immediately fail.
The Kubernetes docs feature a lot of nice tips for debugging (kubernetes.io)
Did you know that JetBrains makes it easy to add logging while you’re debugging? Just highlight the code you want to log the value of, then SHIFT-CLICK the gutter to set a logging point during debugging!
Want to copy a file out of an image, without running it? You can’t, however you can create a non-running container that will spin up a lite/idle container that will do the job. Just make sure to rm it when you’re done. Notice how helpful it was for later commands to name the container when it was created! Here’s an example workflow to copy out some.file. (docs.docker.com)
We explore the evolution of automation as we continue studying Google’s Site Reliability Engineering, while Michael, ah, forget it, Joe almost said it correctly, and Allen fell for it.
rupeshbende asks: How do you find time to do this along with your day job and hobbies as this involves so much studying on your part?
Survey Says
Automation
Why Do We Automate Things?
The famous “SRE Book” from Google
Consistency: Humans make mistakes, even on simple tasks. Machines are much more reliable. Besides, tasks like creating accounts, resetting passwords, applying updates aren’t exactly fun.
Platform: Automation begets automation, smaller tasks can be tweaked or combined into bigger ones.
Pays dividends, providing value every time it’s used as opposed to toil which is essentially a tax.
Platforms centralize logic too, making it easier to organize, find, and fix issues.
Automation can provide metrics, measurements that can be used to make better decisions.
Faster Repairs: The more often automation runs, it hits the same problems and solutions which brings down the average time to fix. The more often the process runs, the cheaper it becomes to repair.
Faster Actions: Automations are faster than humans. Many automations would be prohibitively expensive for humans to do,
Time Saving: It’s faster in terms of actions, and anybody can run it.
If we are engineering processes and solutions that are not automatable, we continue having to staff humans to maintain the system. If we have to staff humans to do the work, we are feeding the machines with the blood, sweat, and tears of human beings. Think The Matrix with less special effects and more pissed off System Administrators.
Joseph Bironas
The Value of SRE at Google
Google has a strong bias for automation because of their scale.
Google’s core is software, and they don’t want to use software where they don’t own the code and they don’t want processes in place that aren’t automated. You can’t scale tribal knowledge.
They invest in platforms, i.e. systems that can be improved and extended over time.
Google’s Use Cases for Automation
Much of Google’s automation is around managing the lifecycle of systems, not their data.
They use tools such as chef, puppet, cfengine, and PERL(!?).
The trick is getting the right level of abstraction.
Higher level abstractions are easier to work with and reason about, but are “leaky”.
Hard to account for things like partial failures, partial rollbacks, timeouts, etc.
The more generic a solution, the easier it is to apply more generally and tend to be more reusable, but the downside is that you lose flexibility and resolution.
The Use Cases for Automation
Google’s broad definition of automation is “meta-software”: software that controls software.
Examples:
Account creation, termination,
Cluster setup, shutdown,
Software install and removal,
Software upgrades,
Configuration changes, and
Dependency changes
A Hierarchy of Automation Classes
Ideally you wouldn’t need to stitch systems together to get them to work together.
Systems that are separate, and glue code can suffer from “bit rot”, i.e. changes to either system can work poorly with each other or with the havoc.
Glue code is some of the hardest to test and maintain.
There are levels of maturity in a system. The more rare and risky a task is, the less likely it is to be fully automated.
Maturity Model
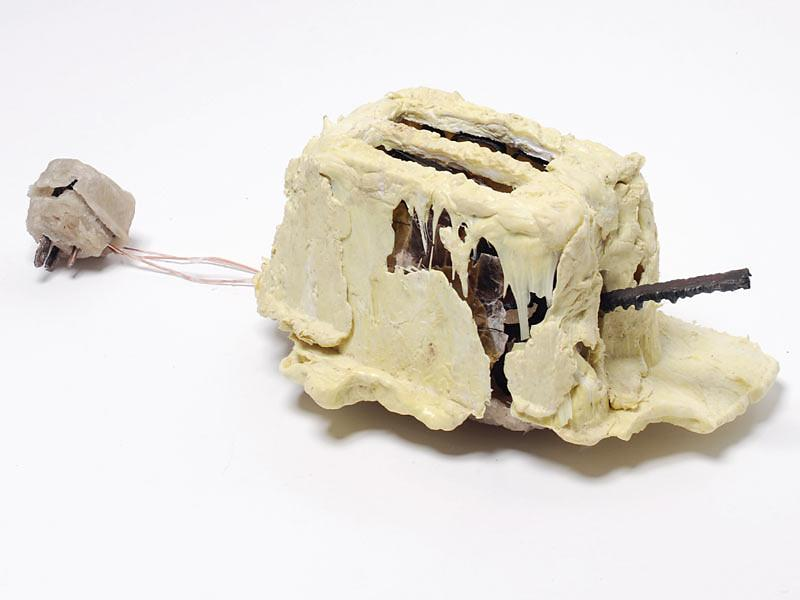
When your levels of abstraction get to be very sophisticated, you can lose the ability to work effectively at a lower level. Kind of like trying to make your own toaster today (Gizmodo).
No automation: database failover to a new location manually.
Externally maintained system-specific automations: SRE has a couple commands they run in their notes.
Externally maintained generic system-specific automation: SRE adds a script to a playbook.
Internally maintained system-specific automation: the database ships with a script.
System doesn’t need automation: Database notices and automatically fails over.
Can you automate so much that developers are unable to manually support systems when a (very rare) need occurs?
Resources we Like
Links to Google’s free books on Site Reliability Engineering (sre.google)
Chapter 7: The Evolution of Automation at Google (sre.google)
Ultimate List of Programmer Jokes, Puns, and other Funnies (Medium)
Shared success in building a safer open source community (blog.google)
One Man’s Nearly Impossible Quest to Make a Toaster From Scratch (Gizmodo)
The Man Who Spent 17 Years Building The Ultimate Lamborghini Replica In His Basement Wants to Sell It (Jalopnik)
Tip of the Week
There’s an easy way to seeing Mongo queries that are running in your Spring app, by just setting the appropriate logging level like: logging.level.org.springframework.data.mongodb.core.MongoTemplate=DEBUG
This can be easily done at runtime if you have actuators enabled: (Spring)
There’s a new, open-core product from Grafana called OnCall that helps you manage production support. Might be really interesting if you’re already invested in Grafana and a lot of organizations are invested in Grafana. (Grafana)
How can you configure your Docker container to run as a restricted user? It’s easy! (docs.docker.com)
User <user>[:<group>]
User <UID>[:<GID>]
iOS – Remember the days of being about to rearrange your screens in iTunes? Turns out you still can, but in iOS. Tap and hold the dots to rearrange them! (support.apple.com)
We finished. A chapter, that is, of the Site Reliability Engineering book as Allen asks to make it weird, Joe has his own pronunciation, and Michael follows through on his promise.
Retool – Stop wrestling with UI libraries, hacking together data sources, and figuring out access controls, and instead start shipping apps that move your business forward.
Shortcut – Project management has never been easier. Check out how Shortcut is project management without all the management.
Another great post from @msuriar, this time about the value of hiring junior developers. (suriar.net)
Survey Says
More about Monitoring Less
The famous “SRE Book” from Google
Instrumentation and Performance
Need to be careful and not just track times, such as latencies, on medians or means.
A better way is to bucketize the data as a histogram, meaning to count how many instances of a request occurred in the given bucket, such as the example latency buckets in the book of 0ms – 10ms, 10ms – 30ms, 30ms-100ms, etc.
Choosing the Appropriate Resolution for Measurements
The gist is that you should measure at intervals that support the SLO’s and SLA’s.
For example, if you’re targeting a 99.9% uptime, there’s no reason to check for hard-drive fullness more than once or twice a minute.
Collecting measurements can be expensive, for both storage and analysis.
Best to take an approach like the histogram and keep counts in buckets and aggregate the findings, maybe per minute.
As Simple as Possible, No Simpler
It’s easy for monitoring to become very complex:
Alerting on varying thresholds and measurements,
Code to detect possible causes,
Dashboards, etc.
Monitoring can become so complex that it becomes difficult to change, maintain, and it becomes fragile.
Some guidelines to follow to keep your monitoring useful and simple include:
Rules that find incidents should be simple, predictable and reliable,
Data collection, aggregation and alerting that is infrequently used (the book said less than once a quarter) should be a candidate for the chopping block, and
Data that is collected but not used in any dashboards or alerting should be considered for deletion.
Avoid attempting to pair simple monitoring with other things such as crash detection, log analysis, etc. as this makes for overly complex systems.
Tying these Principles Together
Google’s monitoring philosophy is admittedly maybe hard to attain but a good foundation for goals.
Ask the following questions to avoid pager duty burnout and false alerts:
Does the rule detect something that is urgent, actionable and visible by a user?
Will I ever be able to ignore this alert and how can I avoid ignoring the alert?
Does this alert definitely indicate negatively impacted users and are there cases that should be filtered out due to any number of circumstances?
Can I take action on the alert and does it need to be done now and can the action be automated? Will the action be a short-term or long-term fix?
Are other people getting paged about this same incident, meaning this is redundant and unnecessary?
Those questions reflect these notions on pages and pagers:
Pages are extremely fatiguing and people can only handle a few a day, so they need to be urgent.
Every page should be actionable.
If a page doesn’t require human interaction or thought, it shouldn’t be a page.
Pages should be about novel events that have never occurred before.
It’s not important whether the alert came from white-box or black-box monitoring.
It’s more important to spend effort on catching the symptoms over the causes and only detect imminent causes.
Monitoring for the Long Term
Monitoring systems are tracking ever-changing software systems, so decisions about it need to be made with long term in mind.
Sometimes, short-term fixes are important to get past acute problems and buy you time to put together a long term fix.
Two case studies that demonstrate the tension between short and long term fixes
Bigtable SRE
Originally Bigtable’s SLO was based on an artificial, good client’s mean performance.
Bigtable had some low level problems in storage that caused the worst 5% of requests to be significantly slower than the rest.
These slow requests would trip alerts but ultimately the problems were transient and unactionable.
People learned to de-prioritize these alerts, which sometimes were masking legitimate problems.
Google SRE’s temporarily dialed back the SLO to the 75th percentile to trigger fewer alerts and disabled email alerts, while working on the root cause, fixing the storage problems.
By slowing the alerts it gave engineers the breathing room they needed to deep dive the problem.
Gmail
Gmail was originally built on a distributed process management system called Workqueue which was adapted to long-lived processes.
Tasks would get de-scheduled causing alerts, but the tasks only affected a very small number of users.
The root cause bugs were difficult to fix because ultimately the underlying system was a poor fit.
Engineers could “fix” the scheduler by manually interacting with it (imagine restarting a server every 24 hours).
Should the team automate the manual fix, or would this just stall out what should be the real fix?
These are 2 red flags: Why have rote tasks for engineers to perform? That’s toil. Why doesn’t the team trust itself to fix the root cause just because an alarm isn’t blaring?
What’s the takeaway? Do not think about alerts in isolation. You must consider them in the context of the entire system and make decisions that are good for the long term health of the entire system.
Resources we Like
Links to Google’s free books on Site Reliability Engineering (sre.google)
Python has built in functionality for dynamically reloading modules: Reloading modules in Python. (GeeksForGeeks)
Dockerfile tips-n-tricks:
Concatenate RUN statements like RUN some_command && some_other_command instead of splitting it out into two separate RUN command strings to reduce the layer count.
Prefer apk add --no-cache some_package over apk update && apk add some_package to reduce the layer and image size. And if you’re using apt-get instead of apk, be sure to include apt-get clean as the final command in the RUN command string to keep the layer small.
When using ADD and COPY, be aware that Docker will need the file(s)/directory in order to compute the checksum to know if a cached layer already exists. This means that while you can ADD some_url, Docker needs to download the file in order to compute the checksum. Instead, use curl or wget in a RUN statement when possible, because Docker will only compute the checksum of the RUN command string before executing it. This means you can avoid unnecessarily downloading files during builds (especially on a build server and especially for large files). (docs.docker.com)
We haven’t finished the Site Reliability Engineering book yet as we learn how to monitor our system while the deals at Costco as so good, Allen thinks they’re fake, Joe hasn’t attended a math class in a while, and Michael never had AOL.
Retool – Stop wrestling with UI libraries, hacking together data sources, and figuring out access controls, and instead start shipping apps that move your business forward.
Shortcut – Project management has never been easier. Check out how Shortcut is project management without all the management.
News
Thank you for the reviews! just_Bri, 1234556677888999900000, Mannc, good beer hunter
Post-Incident Review on the Atlassian April 2022 outage (Atlassian)
Great episode on All The Code featuring Brandon Lyons and his journey to Microsoft. (ListenNotes.com)
Couldn’t resist posting this:
Survey Says
Monitor Some of the Things
Terminology
Monitoring – Collecting, processing, and aggregating quantitative information about a system.
White-box monitoring – Monitoring based on metrics exposed by a system, i.e. logs, JVM profiling, etc.
Black-box monitoring – Monitoring a system as a user would see it.
Dashboard – Provides a summary view of the most important service metrics. May display team information, ticket queue size, high priority bugs, current on call engineer, recent pushes, etc.
Alert – Notification intended to be read by a human, such as tickets, email alerts, pages, etc.
Root cause – A defect, that if corrected, creates a high confidence level that the same issue won’t be seen again. There can be multiple root causes for a particular incident (including a lack of testing!)
Node and machine – A single instance of a running kernel.
Kernel – The core of the operating system. Generally controls everything on the system, always resident in memory, and facilitates interactions between the system hardware and software. (Wikipedia)
There could be multiple services worth monitoring on the same node that could be either related or unrelated.
Push – Any change to a running service or it’s configuration.
Why Monitor?
The famous “SRE Book” from Google
Some of the main reasons include:
To analyze trends,
To compare changes over time, and
Alerting when there’s a problem.
To build dashboards to answer basic questions.
Ad hoc analysis when things change to identify what may have caused it.
Monitoring lets you know when the system is broken or may be about to break.
You should never alert just if something seems off.
Paging a human is an expensive use of time.
Too many pages may be seen as noise and reduce the likelihood of thorough investigation.
Effective alerting systems have good signal and very low noise.
Setting Reasonable Expectations for Monitoring
Monitoring complex systems is a major undertaking.
The book mentions that Google SRE teams with 10-12 members have one or two people focused on building and maintaining their monitoring systems for their service.
They’ve reduced the headcount needed for maintaining these systems as they’ve centralized and generalized their monitoring systems, but there’s still at least one human dedicated to the monitoring system.
They also ensure that it’s not a requirement that an SRE stare at the screen to identify when a problem comes up.
Google has since moved to simpler and faster monitoring systems that provide better tools for ad hoc analysis and avoid systems that try to determine causality
This doesn’t mean they don’t monitor for major changes in common trends.
SRE’s at Google seldom use tiered rule triggering.
Why? Because they’re constantly changing their service and/or infrastructure.
When they do alert on these dependent types of rules, it’s when there’s a common task that’s carried out that is relatively simple.
It is critical that from the instant a production issue arises, that the monitoring system alert a human quickly, and provide an easy to follow process that people can use to find the root cause quickly.
Alerts need to be simple to understand and represent the failure clearly.
Symptoms vs Causes
A monitoring system should answer these two questions:
What is broken? This is the symptom.
Why is it broken? This is the cause.
The book says that drawing the line between the what and why is one of the most important ways to make a good monitoring system with high quality signals and low noise.
An example might be:
Symptom: The web server is returning 500s or 404s,
Cause: The database server ran out of hard-drive space.
Black-Box vs White-Box
Google SRE’s use white-box monitoring heavily, and much less black-box monitoring except for critical uses.
White-box monitoring relies on inspecting the internals of a system.
Black-box monitoring is symptom oriented and helps identify unplanned issues.
Interesting takeaway for the white-box monitoring is this exposes issues that may be hidden by things like retries.
A symptom for one team can be a cause for another.
White-box monitoring is crucial for telemetry.
Example: The website thinks the database is slow, but does the database think itself is slow? If not, there may be a network issue.
Benefit of black-box monitoring for alerting is black-box monitoring indicates a problem that is currently happening, but is basically useless in letting you know that a problem may happen.
Four Golden Signals
Latency – The time it takes to service a request.
Important to separate successful request latency vs failed request latency.
A slow error is worse than a fast error!
Traffic – How much demand is being placed on your system, such as requests per second for a web request, or for streaming audio/video, it might be I/O throughput.
Errors – The rate of requests that fail, either explicitly or implicitly.
Explicit errors are things like a 500 HTTP response.
Implicit might be any request that took over 2 seconds to finish if your goal is to respond in less than 2 seconds.
Saturation – How full your service is.
A measure of resources that are the most constrained, such as CPU or I/O, but note that things usually start to degrade before 100% utilization.
This is why having a utilization target is important.
Latency increases are often indicators of saturation.
Measuring 99% response time over a small interval can be an early signal of saturation.
Saturation also concerns itself when predicting imminent issues, like filling up drive space, etc.
Resources we Like
Links to Google’s free books on Site Reliability Engineering (sre.google)
Post-Incident Review on the Atlassian April 2022 outage (Atlassian)
Great episode on All The Code featuring Brandon Lyons and his journey to Microsoft. (ListenNotes.com)
Tip of the Week
Prometheus has configurations that let you tune how often it looks for metrics, i.e. the scrape_interval. Too much and you’re wasting resources, not enough and you can miss important information and get false alerts. (Prometheus)
There’s a reason WordPress is so popular. It’s fast and easy to setup, especially if you use Webinonly. (Webinonly.com)
Looking for great encryption libraries for Java or PHP? Check out Bouncy Castle! (Bouncy Castle)
Big thanks to @bicylerepairmain for the tip on the running lines of code in VS Code with a keyboard shortcut. The option workbench.action.terminal.runSelectedText is under File -> Preferences -> Keyboard Shortcuts. (Stack Overflow)
Need to see all of the files you’ve changed since you branched off of a commit? Use git diff --name-only COMMIT_ID_SHA HEAD. (git-scm.com)
Couple with Allen’s tip from episode 182 to make it easier to find that starting point!
We say “toil” a lot this episode while Joe saw a movie, Michael says something controversial, and Allen’s tip is to figure it out yourself, all while learning how to eliminate toil.
Retool – Stop wrestling with UI libraries, hacking together data sources, and figuring out access controls, and instead start shipping apps that move your business forward.
Shortcut – Project management has never been easier. Check out how Shortcut is project management without all the management.
Reviews
Thank you for the reviews! AA, Franklin MacDunnaduex, BillyVL, DOM3ag3
Toil is not just work you don’t wanna do, nor is it just administrative work or tedious tasks.
Toil is different for every individual.
Some administrative work has to be done and is not considered toil but rather it’s overhead.
HR needs, trainings, meetings, etc.
Even some tedious tasks that pay long term dividends cannot be considered toil.
Cleaning up service configurations was an example of this.
Toil further defined is work that is often times manual, repetitive, can be automated, has no real value, and/or grows as the service does.
Manual – Something a human has to do.
Repetitive – Running something once or twice isn’t toil. Having to do it frequently is.
Automatable – If a machine can do it, then it should be done by the machine. If the task needs human judgement, it’s likely not toil.
Tactical – Interrupt driven rather than strategy driven. May never be able to eliminate completely but the goal is to minimize this type of work.
No enduring value – If your service didn’t change state after the task was completed, it was likely toil. If there was a permanent improvement in the state of the service then it likely wasn’t toil.
O(n) with service growth – If the amount of work grows with the growth of your service usage, then it’s likely toil.
Why is Less Toil Better?
At Google, the goal is to keep each SRE’s toil at less than 50%.
The other 50% should be developing solutions to reduce toil further, or make new features for a service.
Where features mean improving reliability, performance, or utilization.
The goal is set at 50% because it can easily grow to 100% of an SRE’s time if not addressed.
The time spent reducing toil is the “engineering” in the SRE title.
This engineering time is what allows the service to scale with less time required by an SRE to keep it running properly and efficiently.
When Google hires an SRE, they promise that they don’t run a typical ops organization and mention the 50% rule. This is done to help ensure the group doesn’t turn into a full time ops team.
Calculating Toil
The book gave the example of a 6 person team and a 6 week cycle:
Assuming 1 week of primary on-call time and 1 week of secondary on-call time, that means an SRE has 2 of 6 weeks with “interrupt” type of work, or toil, meaning 33% is the lower bound of toil.
With an 8 person team, you move to an 8 week cycle, so 2 weeks on call out of 8 weeks mean a 25% toil lower bound.
At Google, SRE’s report their toil is spent most on interrupts (non-urgent, service related messages), then on-call urgent responses, then releases and pushes.
Surveys at Google with SRE’s indicate that the average time spent in toil is closer to 33%.
Like all averages, it leaves out outliers, such as people who spend 0 time toiling, and others who spend as much as 80% of their time on toil.
If there is someone taking on too much toil, it’s up to the manage to spread that out better.
What Qualifies as Engineering?
Work that requires human judgement,
Produces permanent improvements in a service and requires strategy,
Design driven approach, and
The more generic or general, the better as it may be applied to multiple services to get even greater gains in efficiency and reliability.
Typical SRE Activities
Software engineering – Involves writing or modifying code.
Systems engineering – Configuring systems, modifying configurations, or documenting systems that provide long term improvements.
Toil – Work that is necessary to run a service but is manual, repetitive, etc.
Overhead – Administrative work not directly tied to a service such as hiring, HR paperwork, meetings, peer-reviews, training, etc.
The 50% goal is over a few quarters or year. There may be some quarters where toil goes above 50%, but that should not be sustained. If it is, management needs to step in and figure out how to bring that back into the goal range.
“Let’s invent more, and toil less”
Site Reliability Engineering: How Google Runs Production Systems
Is Toil Always Bad?
The fact that some amount of toil is predictable and repeatable makes some individuals feel like they’re accomplishing something, i.e. quick wins that may be low risk and low stress.
Some amount of toil is expected and unavoidable.
When the amount of time spent on toil becomes too large, you should be concerned and “complain loudly”.
Potential issues with large amounts of toil:
Career stagnation – If you’re not spending enough time on projects, your career progression will suffer.
Low morale – Too much toil leads to burnout, boredom, and being discontent.
Too much time on toil also hurts the SRE team.
Creates confusion – The SRE team is supposed to do engineering, and if that’s not happening, then the goal of the team doesn’t match the work being done by the team.
Slows progress – The team will be less productive if they’re focused on toil.
Sets precedent – If you take on too much toil regularly, others will give you more.
Promotes attrition – If your group takes on too much toil, talented engineers in the group may leave for a position with more development opportunities.
Causes breach of faith – If someone joins the team but doesn’t get to do engineering, they’ll feel like they were sold a bill of goods.
Commit to cleaning up a bit more toil each week with engineering activities.
Resources We Like
Links to Google’s free books on Site Reliability Engineering (sre.google)
The Greatest Inheritance, uh stars Jaleel White (IMDb)
Clean Code – How to Write Amazing Unit Tests (episode 54)
DevOps Vs SRE: Enabling Efficiency And Resiliency (harness.io)
Tip of the Week
Pandas is a great tool for data analysis. It’s fast, flexible and easy to use. Easy to work with information from GCS buckets. (pandas.pydata.org)
7 GUIs you can build to study graphical user interface design. Start with a counter and build up to recreating Excel, programming language agnostic! (eugenkiss.github.io)
Did you know there’s a bash util for sorting, i.e. sort? (manpages.ubuntu.com)
Using Minikube? Did you know you can transfer images with minikube image save from your Minikube environment to Docker easily? Useful for running things in a variety of ways. (minikube.sigs.k8s.io)
Ever have a multi-stage docker, where you only wanted to build one of the intermediary stages? Great for debugging as well as part of your caching strategy, use docker build --target <stage name> to build those intermediary stages. (docs.docker.com)
Welcome to the morning edition of Coding Blocks as we dive into what service level indicators, objectives, and agreements are while Michael clearly needs more sleep, Allen doesn’t know how web pages work anymore, and Joe isn’t allowed to beg.
Shortcut – Project management has never been easier. Check out how Shortcut is project management without all the management.
Survey Says
News
Monolithic repos … meh. But monolithic builds … oh noes.
Chapter 4: Service Level Objectives
The famous “SRE Book” from Google
Service Level Indicators
A very well and carefully defined metric of some aspect of the service or system.
Response latency, error rate, system throughput are common SLIs.
SLIs are typically aggregated over some predefined period of time.
Usually, SLIs directly measure some aspect of a system but it’s not always possible, as with client side latency.
Availability is one of the most important SLIs often expressed as a ratio of the number of requests that succeed, sometimes called yield.
For storage purposes, durability, i.e. the retention of the data over time, is important.
Service Level Objectives
The SLO is the range of values that you want to achieve with your SLIs.
Choosing SLOs can be difficult. For one, you may not have any say in it!
An example of an SLO would be for response latency to be less than 250ms.
Often one SLI can impact another. For instance, if your number of requests per second rises sharply, so might your latency.
It is important to define SLOs so that users of the system have a realistic understanding of what the availability or reliability of the system is. This eliminates arbitrary “the system is slow” or the “system is unreliable” comments.
Google provided an example of a system called Chubby that is used extensively within Google where teams built systems on top of Chubby assuming that it was highly available, but no claim was made to that end.
Sort of crazy, but to ensure service owners didn’t have unrealistic expectations on the Chubby’s up-time, they actually force downtime through the quarter.
Service Level Agreements
These are the agreements of what is to happen if/when the SLOs aren’t met.
If there is no consequence, then you’re likely talking about an SLO and not an SLA.
Typically, SLA’s consequences are monetary, i.e. there will be a credit to your bill if some service doesn’t meet it’s SLO.
SLAs are typically decided by the business, but SREs help in making sure SLO consequences don’t get triggered.
SREs also help come up with objective ways to measure the SLOs.
Google search doesn’t have an SLA, even though Google has a very large stake in ensuring search is always working.
However, Google for Work does have SLAs with its business customers.
What Should You Care About?
You should not use every metric you can find as SLIs.
Too many and it’s just noisy and hard to know what’s important to look at.
Too few and you may have gaps in understanding the system reliability.
A handful of carefully selected metrics should be enough for your SLIs.
Some Examples
User facing services:
Availability – could the request be serviced,
Latency – how long did it take the request to be serviced, and
Throughput – how many requests were able to be serviced.
Storage systems:
Latency – how long did it take to read/write,
Availability – was it available when it was requested, and
Durability – is the data still there when needed.
Big data systems:
Throughput – how much data is being processed, and
End to end latency – how long from ingestion to completion of processing.
Everything should care about correctness.
Collecting Indicators
Many metrics come from the server side.
Some metrics can be scraped from logs.
Don’t forget about client-side metric gathering as there might be some things that expose bad user experiences.
Example Google used is knowing what the latency before a page can be used is as it could be bad due to some JavaScript on the page.
Aggregation
Typically aggregate raw numbers/metrics but you have to be careful.
Aggregations can hide true system behavior.
Example given averaging requests per second: if odd seconds have 200 requests per second and even seconds have 0, then your average is 100 but what’s being hidden is your true burst rate of 200 requests.
Same thing with latencies, averaging latencies may paint a pretty picture but the long tail of latencies may be terrible for a handful of users.
Using distributions may be more effective at seeing the true story behind metrics.
In Prometheus, using a Summary metric uses quantiles so that you can see typical and worst case scenarios.
Quantile of 50% would show you the average request, while
Quantile of 99.99% would show you the worst request durations.
A really interesting takeaway here is that studies have shown that users prefer a system with low-variance but slower over a system with high variance but mostly faster.
In a low-variance system, SREs can focus on the 99% or 99.99% numbers, and if those are good, then everything else must be, too.
At Google, they prefer distributions over averages as they show the long-tail of data points, as mentioned earlier, averages can hide problems.
Also, don’t assume that data is distributed normally. You need to see the real results.
Another important point here is if you don’t truly understand the distribution of your data, your system may be taking actions that are wrong for the situation. For instance, if you think that you are seeing long latency times but you don’t realize that those latencies actually occur quite often, your systems may be restarting themselves prematurely.
Standardize some SLIs
This just means if you standardize on how, when, and what tools you use for gathering some of the metrics, you don’t have to convince or describe those metrics on every new service or project. Examples might include:
Aggregation intervals – distribution per minute, and
Frequency of metrics gathered – pick a time such as every 5 seconds, 10, etc.
Build reusable SLI templates so you don’t have to recreate the wheel every time.
Objectives in Practice
Find out what the users care about, not what you can measure!
If you choose what’s easy to measure, your SLOs may not be all that useful.
Defining Objectives
SLOs should define how they’re measured and what conditions make them valid.
Example of a good SLO definition – 99% of RPC calls averaged over one minute return in 100ms as measured across all back-end servers.
It is unrealistic to have your SLOs met 100%..
As we mentioned in the previous episode, striving for 100% takes time away from adding new features or makes your team design overly conservatively.
This is why you should operate with an error budget.
An error budget is just an SLO for meeting other SLOs!
Site Reliability Engineering: How Google Runs Production Systems
Choosing Targets
Don’t choose SLO targets based on current performance.
Keep the SLOs simple. Making them overly complex makes them hard to understand and may be difficult to see impacts of system changes.
Avoid absolutes like “can scale infinitely”. It’s likely not true, and if it is, that means you had to spend a lot of time designing it to be that way and is probably overkill.
Have as few SLOs as possible. You want just enough to be able to ensure you can track the status of your system and they should be defendable.
Perfection can wait. Start with loose targets that you can refine over time as you learn more.
SLOs should be a major driver in what SREs work on as they reflect what the business users care about
Control Measures
Kubernetes is great but … it’s complicated!
Monitor system SLIs.
Compare SLIs to SLOs and see if action is needed.
If action is needed, figure out what action should be taken.
Take the action.
Example that was given is if you see latency climbing, and it appears to be CPU bound, then increasing the CPU capacity should lower latencies and not trigger an SLO consequence.
SLOs Set Expectations
Publishing SLOs make it so users know what to expect.
You may want to use one of the following approaches:
Keep a safety margin by having a stricter internal SLO than the public facing SLO.
Don’t overachieve. If your performance is consistently better than your SLO, it might be worth introducing purposeful downtime to set user expectations more in line with the SLO, i.e. failure injection.
Agreements in Practice
The SRE’s role is to help those writing SLAs understand the likelihood or difficulty of meeting the SLOs/SLA being implemented.
You should be conservative in the SLOs and SLAs that you make publicly available.
These are very difficult to change once they’ve been made public.
SLAs are typically misused when actually talking about an SLO. SLA breaches may trigger a court case.
If you can’t win an argument about a particular SLO, it’s probably not worth having an SRE team work on it.
Resources we Like
Links to Google’s free books on Site Reliability Engineering (sre.google)
If you switch to a Mac and you’re struggling with the CMD / CTRL switch from Windows, look for driver software from the keyboard manufacturer as they likely have an option to swap the keys for you!
Metrics aren’t free! Be careful to watch your costs or you can get up to babillions quickly!
Did you know there is a file format you can use to import bookmarks? It’s really simple, just an HTML file. You can even use it for onboarding! (j11g.com)
Powerlevel10k is a Zsh theme that looks nice and is easy to configure, but it’s also good about caching your git status so it doesn’t bog down your computer trying to pull the status on every command, a must for Zsh users with large repos! (GitHub)